
Visualize Orbit Levels with JavaScript and p5.js


Each week we go down rabbit holes so you don't have to. We share tactics, trends and valuable resources we've observed in the world of community building.
💫 Subscribe to The Observatory
Data visualization allows the intuitive side of the brain come up with new information at a glance. It is akin to being in a helicopter and examining the health of the entire forest, instead of deeply investigating a single tree. Looking at data in text format can’t always give you a broad enough view of what the data actually means.
In this post, I'm going to use data from the Orbit API to zoom out to show a high-level visualization of an example community to understand which community members are most engaged. This approach relies heavily on concepts from the Orbit Model.
The project is open source and easy to host if you'd like to set up a version for your own community. Instructions are in the README.
Controlling the visualization
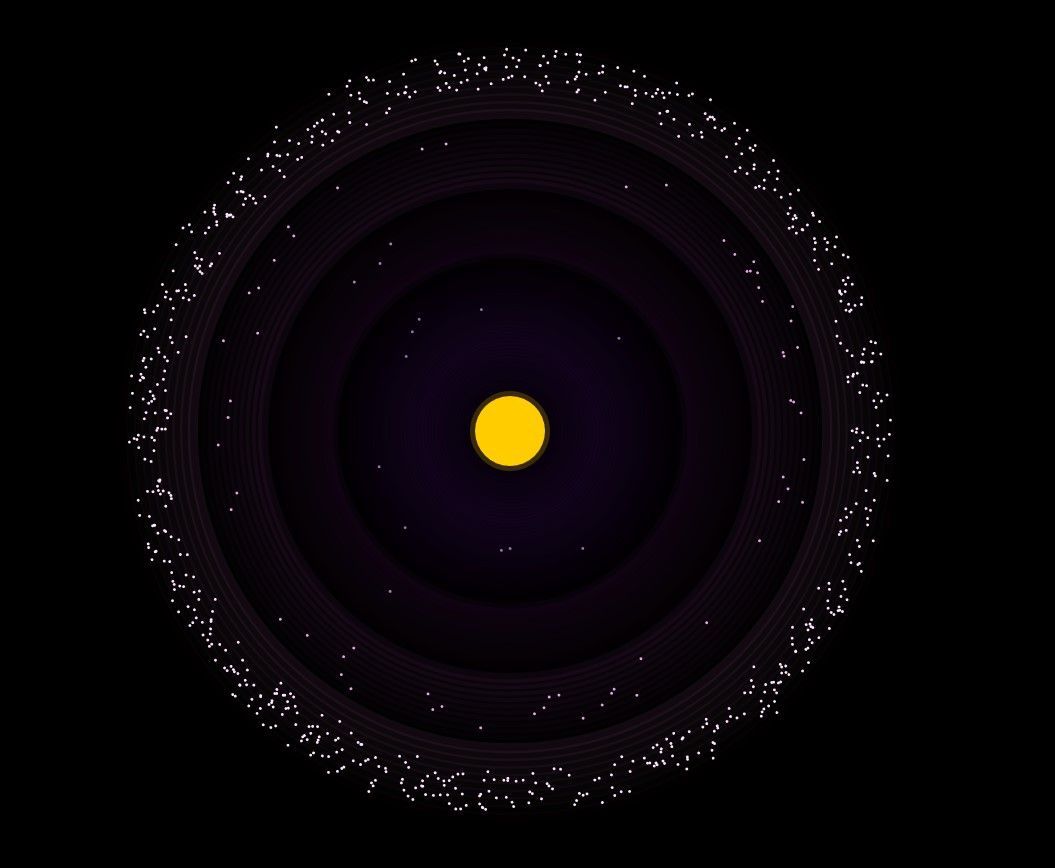
Here's what the visualization looks like. Hover over each level to see the number of members.
The visualization allows you to customize the number of members at each level, as well as some other parameters.
Applying Creativity
Another major benefit of visualization is applied creativity. With libraries like p5.js and d3.js, we can use tools from creative coding to see our data in ways that are both informative and engaging.
For this particular example, we chose to pursue the idea of creating a data visualization that mimics a real solar system.
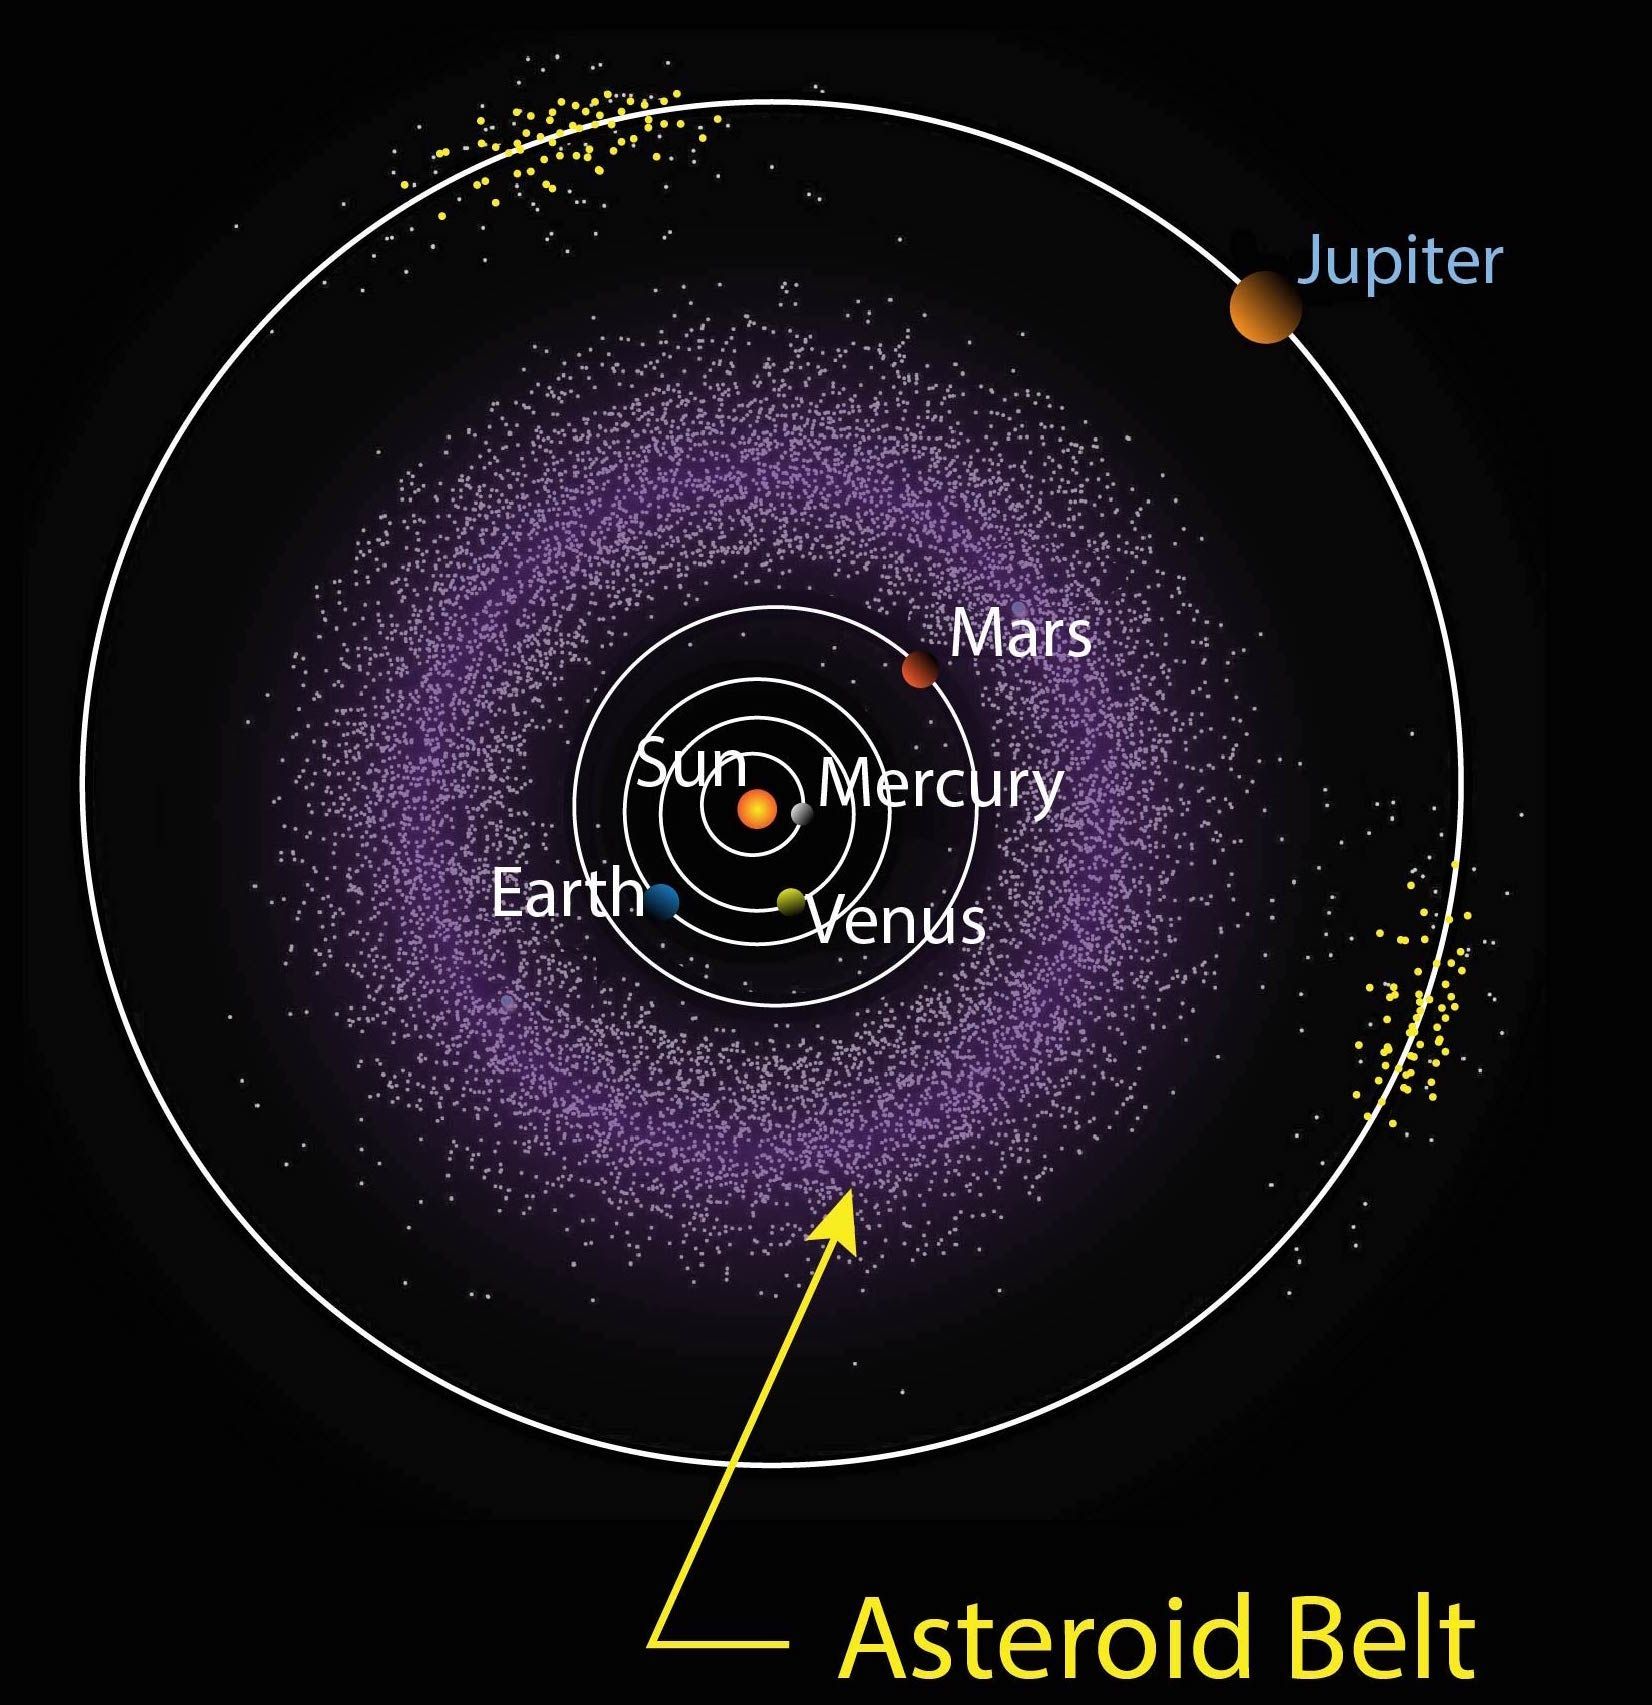
This blog post will break us away from the preconceived notion that data viz is all histograms and line graphs. Let's make some space! 🪐
The Orbit Model
Orbit is a community experience platform that helps organizations stay aware and engaged with their own communities.
Knowing this, we can start to ask different questions about what the organization might be interested in. For example:
- Who are our most engaged members?
- How many new members did our recent blog post draw in?
- How did our engagement change from last month to this month?
Using Orbit's Member API, we can focus on the orbit_level field, since a member's Orbit Level will provide a good proxy for their engagement.
The orbit_level field is a calculation of how engaged a single member of your community is. A member of Orbit level 1 could be commenting on all your blog posts, and submitting pull requests for every open source project, whereas an Orbit level 4 person could have signed up for your newsletter, and has not engaged much since.
Once we have this data we can use our goal to answer our next question: how will we display this thing?
Why p5.js?
For this project, I chose to use p5.js. I chose p5.js for a few reasons.
- p5 leverages the web canvas, which means that it will scale and work on most (all) web browsers
- p5 code is pretty easy to read and understand, as it is based off of the philosophy of Processing
- It is easy to attach a GUI, giving end users real time configuration control
- It doesn't require any external dependencies
Let's take a look at some important methods in the code, and what they do.
The Background
The background is composed of three elements: the vacuum of space (the black stuff), the Sun, and some sort of visual for each orbit level.
{% c-block language="js" %}
drawBackground();
// const drawOortCloud = (outsideDiameter, color_scheme, insideDiameter) => {...}
drawOortCloud(orbit4Diameter, ORBIT_4_COLOR, orbit3Diameter);
drawOortCloud(orbit3Diameter, ORBIT_3_COLOR, orbit2Diameter);
drawOortCloud(orbit2Diameter, ORBIT_2_COLOR, orbit1Diameter);
drawOortCloud(orbit1Diameter, ORBIT_1_COLOR, 0);
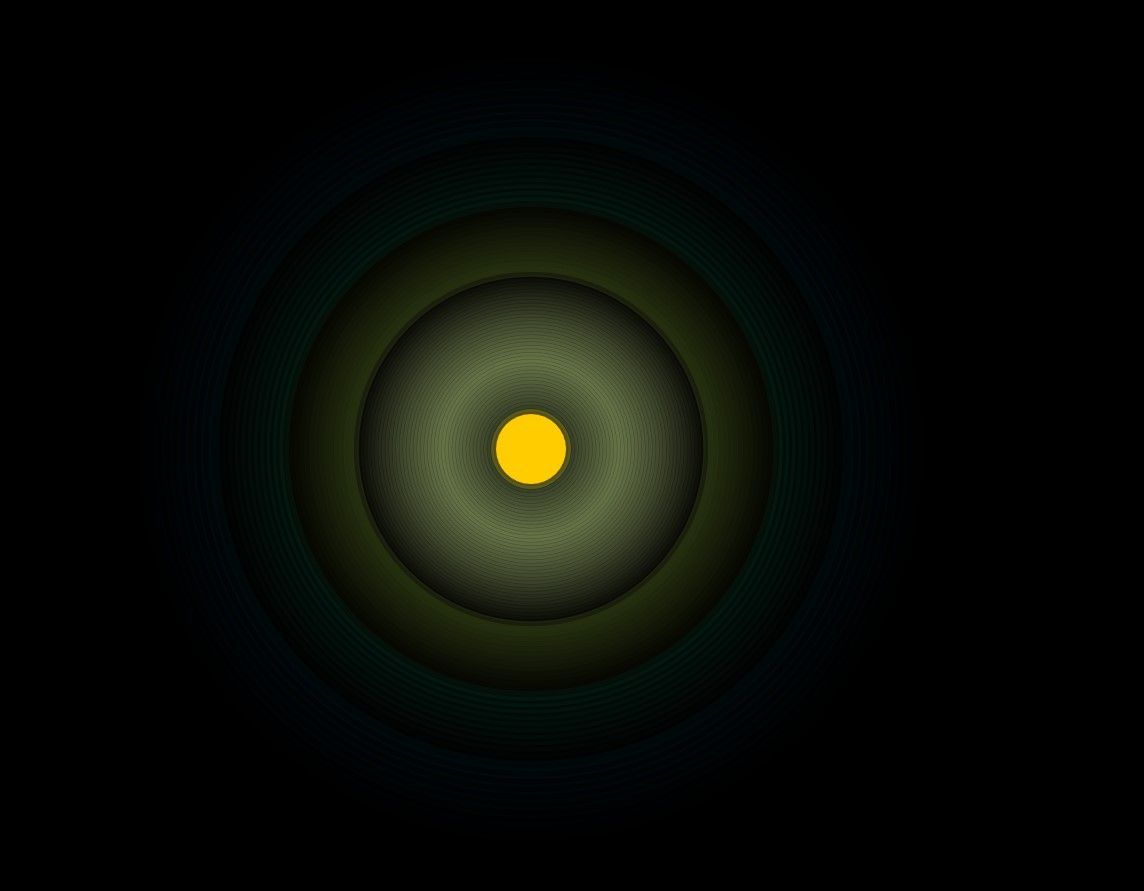
drawSun();
{% c-block-end %}
p5 follows a "sketching" model. Basically, we use shapes and give them positions on the canvas to draw themselves.
For example drawSun() is implemented as follows:
{% c-block language="js" %}
function drawSun() {
noStroke(); // no black lines around our shape
fill(255, 204, 0); // set color to yellow
circle(0, 0, 70); // draw a circle centered at (0,0) with a radius of 70
fill("rgba(255, 204, 0, 0.2)"); // set color to a lower opacity, darker, yellow
circle(0, 0, 80); // draw a circle centered at (0,0) with a radius of 80
fill(0); // reset main drawing color to black
}
{% c-block-end %}
p5 is basically like painting. You add layer on layer and manipulate where things are being drawn to create "animations".
Particles and Planets, Oh My!
Once the background was completed, the next step was to give it planets to live inside it. There are any number of ways to do this, each with their own pros and cons.
The Aggregation Method
The aggregation method is basically the act of summing up every member in each orbit level into one large number, and then using that number to influence the shape of the planet.
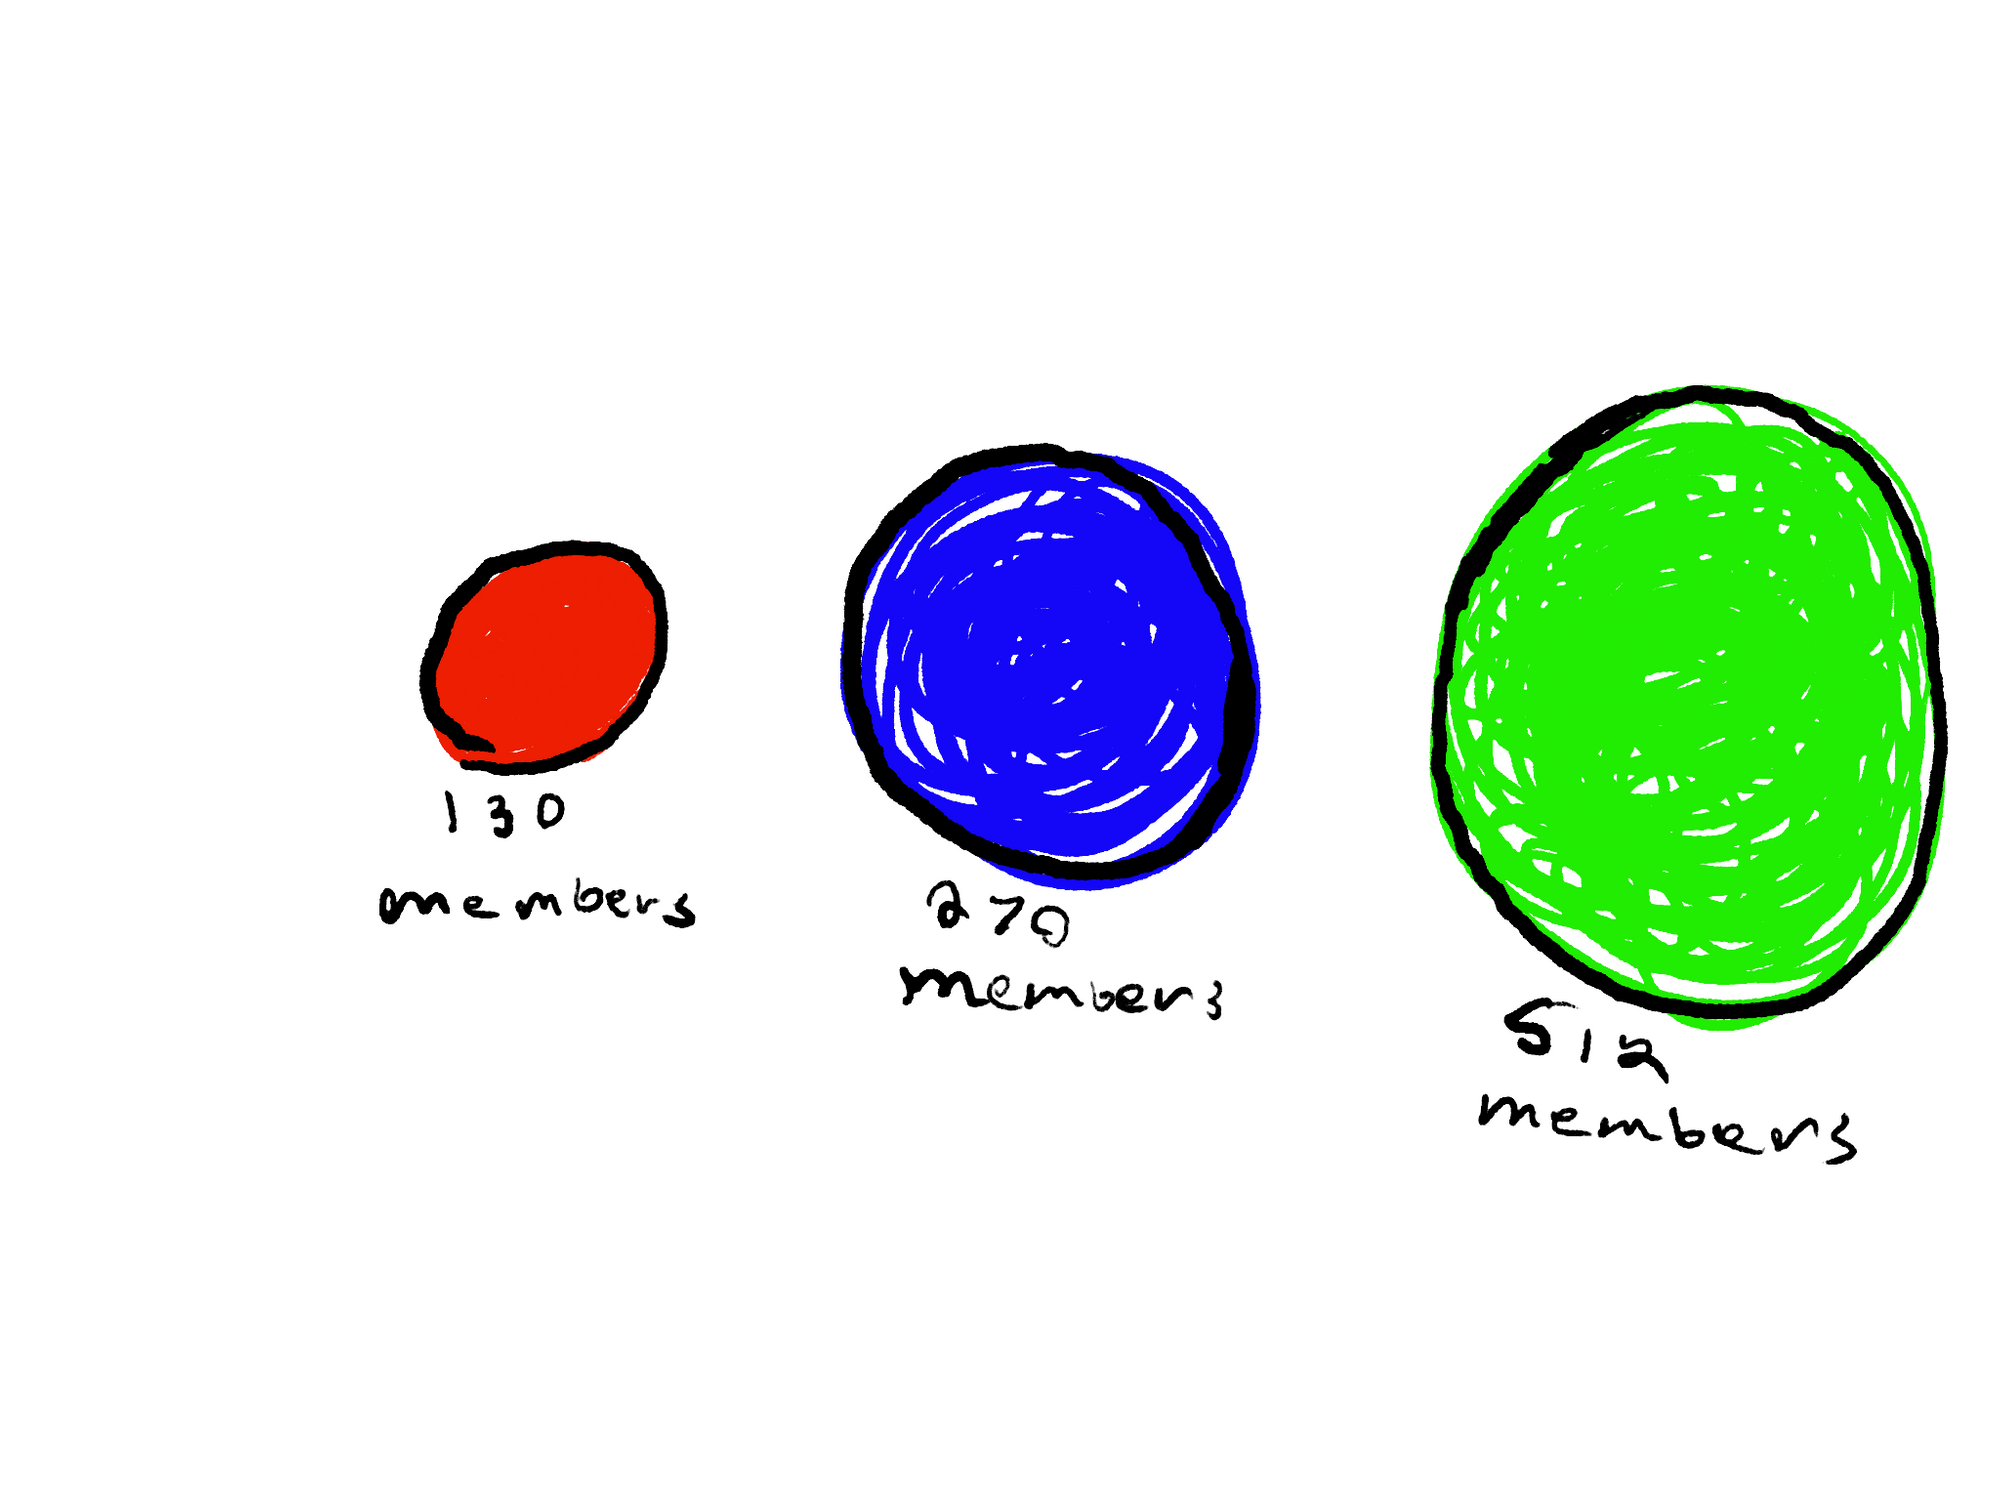
By members, I mean how many people exist in each orbit level.
The main pro of this method is that performance won’t diminish (we’ll discuss why it might later) as we add more and more members to our ecosystem.
The main con of this method is that is not as visually informative as using individual particles. And for data visualization, that is a big deal! Remember, the main value of visualizing data is to get a bird’s eye view of a massive set of data. If you can’t tell which orbit level has the most members at a glance, the visualization isn’t working.
The Particle Method
The second way we could go about creating the planets is by using particles. But what are particles?
Particles are independent objects in a cluster, individual nodes in a larger group.
The main advantage of this method is that well, it looks really cool. Because we can leverage tooltips/other types of data structures to pass exacting data, we can focus in on making the visual as aesthetically pleasing as possible.
But what if there are 10,000 members? 100,000? Remember, each particle is it's own instance, which can cause major fps degradation, especially on computers with older or integrated GPUs!
So how do we fix this?
The Particle Method... with a twist
To counter the FPS issue, we've settled on using a method that limits the number of particles that can be drawn on the screen at any given time. We then use proportions to draw the new number of particles for each level.
That might sound a bit confusing so let's look at an example. Let's say we have 28000 members total in our Orbit. And let's say that we decide that we want no more than max 1000 particles drawn per level.
Our full data set is as follows:
{% c-block language="js" %}
{
level1Members: 360,
level2Members: 540,
level3Members: 3100,
level4Members: 24000
}
{% c-block-end %}
We want to cap 24000 at 1000 and adjust the others to match. That looks something like this in JS:
{% c-block language="js" %}
const MAX_PARTICLES_DRAWN = 1000; // our pre decided threshold
function setProportions() {
const members = [360, 540, 3100, 24000];
// this flag checks to see if we cross our threshold
let overMaxParticles = false;
// these variables keep track of our max index and value which we need for our next calculation
let max = members[0];
let maxIndex = 0;
for (let i = 0; i < members.length; i++) {
if (members[i] > MAX_PARTICLES_DRAWN) overMaxParticles = true;
// fetch max number and max index
if (members[i] > max) {
maxIndex = i;
max = members[i];
}
}
// if flag is raised, we modify each level's particle count before its drawn on the screen
if (overMaxParticles) {
// we want to get the percentages to maintain the ratios of the levels after we change them
const originalProportions = [];
for (let i = 0; i < members.length; i++) {
// ex. if i == 0 => originalProportions.push(360 / 24000)
originalProportions.push(members[i] / max);
}
// put in proportions capped at MAX_PARTICLES_DRAWN and reload how many members are in the group
for (let i = 0; i < originalProportions.length; i++) {
// we want to draw Numbers, not floats! So we use Math.round() to round our fraction up
const proportionMembers = Math.round(
MAX_PARTICLES_DRAWN * originalProportions[i]
);
console.log(proportionMembers);
}
}
}
{% c-block-end %}
Parameters for You, Me, and Everyone You Know!
The final step of any good data visualization is to make it so people can engage with it and learn about what you're conveying.
Play and experimentation is the best way to learn after all!
datgui
Thanks to the way p5 works, it redraws the canvas 60 times per second in the draw() function. That means that we can edit variables in real time and see the results of our work!
For this project, we used datgui a very popular GUI library.
To set it up, we create JS objects with keys that will call some type of update function when clicked or played around with in the GUI:
{% c-block language="js" %}
const planetScale = { scale: 2 }
const colorScheme = { isGreenPalette: false };
const changeColorPalette = (val) => {
...
return newValue
}
gui.add(planetScale, "scale", 2, 5, 1);
gui
.add(colorScheme, "isGreenPalette")
.onChange((val) => changeColorPalette(val));
{% c-block-end %}
How to Add and Play With Your Own Variables
The extended variables that can be modified in the GUI are:
- Planet Speed - how fast they orbit the Sun
- Planet Scale - how big the particles are
- Color Palette - the colors used for the planets and the Oort Clouds
- Member Count - how many active members you have in each orbit level
If any of these interest you, or if you'd like to add some variables of your own, head over to the Github repo and play around!
Conclusion
In this post we learned why we should visualize data in the first place, we talked about how to parse data and leverage creativity, we talked about making compromises for performance and visuals, and we learned how to parameterize our work.
Thanks for reading, and I'll see you in outer space 👨🚀


